Article 29 LEC: Key Takeaways from the 2025 Climate Transparency Hub Analysis
The Climate Transparency Hub (a joint initiative of Ademe and the Sustainable Finance Observatory) has published its annual analysis of the “Article 29 LEC” reports. This time, it focuses on the 2025 reports, which therefore cover the 2024 financial year. A highly detailed 170-page document that WeeFin’s Expertise team has scrutinised to identify the key takeaways.
The Climate Transparency Hub (a joint initiative of Ademe and the Sustainable Finance Observatory) has published its annual analysis of the “Article 29 LEC” reports in France. This time, it focuses on the 2025 reports, which therefore cover the 2024 financial year. A highly detailed 170-page document that WeeFin’s Expertise team has scrutinised to identify the key takeaways.
Climate Strategy
Setting Climate Targets
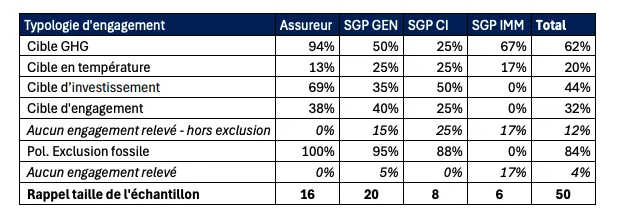
Actors with no targets or coal/oil exclusion policy:
BlackRock France S.A.S (SGP GEN)
La Française Real Estate Manager (SGP IMM)
For 4 other actors, the only commitments identified relate to an exclusion policy:
Amundi Private Equity Funds (SGP CI).
Ardian France (SGP CI)
Natixis IM International (SGP GEN)
Ostrum AM (SGP GEN)
GHG Emissions Targets
2019 is the most commonly used base year
2030 is the most commonly used target year
Average CO2 reduction ambition: -46%, with many targeting -50% by 2030
Scope covered: predominantly 1&2
Alignment between targets and the IEA NZE 2050 report’s 1.5°C-aligned emissions reduction benchmark: Good overall alignment of targets
Observed Performance and Target Tracking:
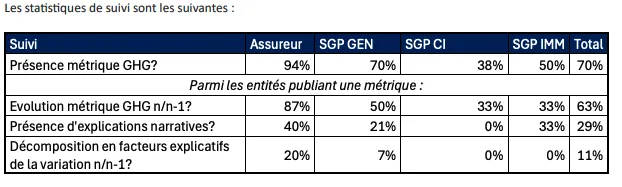
In 37% of cases, no explicit monitoring of the set target was observed in the monitoring reports
Beyond tracking (via charts or tables), the most practically important element is understanding how and why emissions have changed. Such explanatory elements were found in only 15% of cases, with varying levels of detail.
Best practice examples: Sogecap, Abeille Assurances
Target Achievement:
Analysis using the ACT Finance methodology
Financial actors are ahead of / well ahead of a linear reduction trajectory. The average score above 200% highlights that most targets have already been met.
Substantial gap between the evolution of financial portfolio trajectories (advancing at twice the required pace) and the actual evolution of real-economy emissions
Questions raised about the relevance of GHG emissions reduction targets for achieving the Paris Agreement
“Tikehau Capital: As identified by the IIGCC, a portfolio decarbonization reference target (i.e. a GHG emissions reduction target) ‘is not intended to be used or recommended for portfolio optimization, investment decision-making, or as a target-setting tool to reduce financed emissions through year-on-year reductions. Relying solely on financed indicators can lead to decisions that are not aligned with net zero objectives.’”
Recommendations:
Regularly update targets, linking them to the identified levers of action
Rather than observing dated (sometimes two-year-old) ex-post evolutions of uncertain quality (integrity of corporate time series), focus instead on forward-looking analysis of the capacity of investee companies to implement the required emissions reductions.
GHG Emissions Metrics Monitoring
Methodological explanations on how metrics are calculated are of variable quality.
Best practice example: HSBC AM France for carbon intensity
Breaking down into explanatory factors remains a minority practice
Best practices: Abeille Assurances, Groupama AM
Climate Finance
Nearly half of the actors, primarily insurers, have set a financing target.
Assessment of actor definitions and formulations against the ACT Finance framework:
Visualising the heterogeneity of practices and the difficulties in guaranteeing a tangible link between the stated objective and the climate topic
The good quality of SGP definitions is driven by actors — particularly PE actors — that rely on the SBTi framework (Antin, Eurazeo, LBP AM, Rothschild&Co) and on a structured categorisation framework (BNPP AM, AXA IM, Comgest SA, Tikehau).
Financing Targets – Recommendations:
The SBTi FINZ framework offers benchmarks within its portfolio target alignment tools that can serve as a reference for actors wishing to make a financing commitment
The use of self-declared SFDR classifications, without necessarily any tangible climate commitment, is not sufficient on its own to guarantee the quality of the contributory approach on the climate topic.
Sustainability-linked bonds: sometimes mentioned as eligible assets within the scope of ‘green’ assets, the investor’s interest is aligned with the non-achievement of the considered criterion. It may be argued that the financial impact is generally low — to which it may be countered that the incentive nature of the product is equally limited.
Avoid look-through approaches: It is reiterated that the relevance of allocating a flow is measured at the level of the economic actor that benefits from it, and where applicable at the level of the specific project it implements with that flow. It is therefore inadvisable to calculate an AuM rate or a green share by referring to a look-through of positions, where 30% of AuM would be green because 30% of the company’s activity is. Given that the remaining 70% is potentially ‘brown’, the approach may even have a potentially counterproductive effect.
Challenges and Perspectives of Metrics and Indicators in Support of the Climate Strategy
It is necessary to have both forward-looking metrics — based in particular on the analysis of investee companies’ transition plans — and backward-looking metrics
ADEME highlights the value for investors of deploying sector-level monitoring of emissions — expressed both in absolute terms and in physical intensity where possible — and of enriching their perspective through the use of complementary indicators such as I-PEPs indicators.
Temperature scores: it is necessary to account for the weaknesses of these indicators, which are not physically interpretable, and to focus on their ‘score’ aspect
Initiatives aware of the limits of a carbon metric-only approach are pushing to refocus transition management of financial institutions on: investing (or ceasing to invest) and exercising influence (engagement, voting, etc.) → ADEME advocates the adoption of a framework for analysing companies’ transition plans and the low-carbon nature of invested projects, enabling categorisation of issuers and projects according to their climate profile.
In the absence of a global consensus to date on what constitutes a ‘good’ virtuous company (in transition or already green), the following main axes can be highlighted: Taxonomy, CSRD, ACT
Examples of actors: BNPP AM Europe, Comgest SA, AXA IM, Tikehau
Transition plan analysis:
A practice that has developed thanks to the ISR label
Most actors appear to develop proprietary methodologies, based on third-party data where applicable, rather than directly adopting a third-party provider’s assessment
This creates a risk of overly heterogeneous practices and thus different classifications of the same company’s transition level across different actors (no comparability)
Real Estate Focus:
Widespread use of the CRREM tool (to identify the temperature trajectory of a real estate portfolio)
Emphasis on labels, sometimes considered generic and not environmentally focused
The Austrian GFA initiative has worked on developing I-PEPs indicators focused not on the metric itself but on its variation, which presents an interesting alternative.
Climate Engagement
Assessment of engagement mechanisms using the ACT methodology
ACT scores generally low, with an average score of 16%:
PE performing better, followed by AMs and then insurers
No firm mechanism was identified that would, in the absence of favorable developments, lead to the deployment of a pre-established series of measures, up to and including divestment. The observed formulations indicate flexibility and discretion.
Recommendations: actors are encouraged to clarify in their reports:
The specific climate criteria that determine engagement prioritisation;
A coverage rate in terms of interest — for example via financed emissions or carbon intensity — or better yet via a system for categorising companies’ alignment, prioritising non-aligned companies in carbon-intensive sectors.
Best practices:
Engagement scope:
Concentrating efforts on a limited number of companies rather than dispersing them across systematic but superficial means → engagement with at least 20 priority companies or at least 80% of financed emissions covered
Example: Rothschild & Co AM
Engagement framework definition:
A formalised strategy with clear time-bound objectives in terms of coverage, and explicit monitoring
Example: AXA IM
Engagement objectives:
Objectives may vary, but overall, the most relevant objective is to ask large companies in carbon-intensive sectors to adopt a transition plan. Have clear objectives, not just information disclosure.
Example: Antin Infrastructure Partners
Escalation process:
The process must be systematic, scaling up to the possibility of divestment, and implemented within reasonable timeframes.
Example: Crédit Mutuel AM, AXA IM
Voting policy
Best practice: Implementing a punitive vote on approval of financial accounts, renewal of board member mandates, or executive remuneration in the event of non-compliance with certain climate constraints.
Best practices: Crédit Mutuel AM, Arkea
Collaborative Engagement – Recommendations:
Summary table of joined initiatives (Groupama Gan Vie) — a rarely used practice
Participation in the Net Zero Alliance: Elaborate further (list of committed companies and identification process, requested objectives, commitment monitoring) → Best practice: Predica
Stakeholder Engagement:
Engagement of AMs by management companies (AO):
ISS cited more frequently than Glass Lewis
Recommendation: Question and engage different actors on their advisory practices regarding climate-related votes.
Fossil Fuel Phase-out:
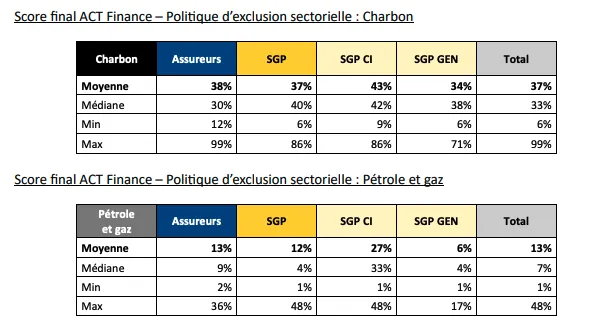
Assessment of policies on the coal and hydrocarbons sectors using the ACT methodology
Coal policy is near-universal; oil and gas policy is frequent
Lack of precision on coverage:
Insurers: only the general fund covered, without considering unit-linked (UC)
AMs: only open-ended funds covered, therefore excluding mandates and dedicated funds
Poor management of exceptions:
Lack of oversight process or discretionary nature; policy deactivated simply at client request
Widespread practice: allowing new investments in green bonds, subsidiaries dedicated to renewable energy projects, or stakes in companies with transition plans, without always clearly describing the precise conditions for considering such plans as credible and robust (best practice: OFI Invest AM)
Coal exclusion rates are better among insurers, as is the commitment to exit coal
Exclusion of expansion projects: significantly less ambitious restrictions on O&G → Best practice: Abeille Assurances
O&G policy: non-consideration of unconventional fossil fuels (only 2 private equity SGPs incorporate the full range of activities: arctic, fracking, tar sands, ultra-deep water)
What not to do: Arguing that a resource is part of the energy mix within an aligned scenario to justify the absence of measures on the exploration of new resources / referring to information cited in a regulator’s report dating back several years that has not been reiterated in a recent report.
Highlighting that exclusion is not necessarily the solution and that engagement may be — but identifying actors that condition the continuation of their financing on tangible climate demands remains rare
Best practices → Abeille Assurance Holding, CNP, Rothschild&Co
Biodiversity
Nearly 40% of the sample actors explicitly reference the Kunming-Montréal targets (particularly 15, 8, 19 and 7)
No concrete biodiversity target linked to the contribution strategy that meets the standards observed for climate (indicator, trend objective, base year, target year).
8/50 actors appear to present no concrete impact, dependency or pressure measure in their report, particularly real estate SGPs.
Sources cited: ENCORE, MSA, NEC, PAI 7/8, SBTN, surface biotope coefficient (real estate), underlying indicators (water consumption, land use)
Frequent mention of metric limitations
Year-on-year variations with explanation from around ten actors (DNCA Finance, Groupama GAN Vie)
No link yet between this measurement exercise and concrete elements of the action plan, investment policy or strategy.
Exclusions:
Deforestation, pesticides, controversies
Climate / ESG: it is necessary to highlight transparently that this type of exclusion considers biodiversity only as a secondary concern
Positive Financing:
40% of the sample actors mention at least one positive investment (investments in companies and activities that contribute to the restoration / preservation of biodiversity, or to the reduction of negative pressures)
Recommendation for the mention of thematic funds: carry out a clear-eyed analysis of the funds’ effective contribution to objectives beyond the theme, to enable transparent and quality information.
Specify how the positive contribution is assessed
Engagement – Recommendations:
Precise objectives to engage a minimum set of companies according to a defined strategy (e.g. all relevant companies for a given topic / harmful practice, or the top X companies selected according to a given process) → Best practice: Abeille
Systematic formulation of demands (‘I have this minimum expectation of all companies in this sector / with respect to this practice’).
Targeted topic → BNPP AM (global pharmaceutical dependence on horseshoe crabs)
Insurers: engagement information vis-à-vis the AMs to whom they delegate all or part of their assets remains insufficiently detailed. (One actor specifies that they are in the process of defining a biodiversity engagement roadmap vis-à-vis asset managers.)
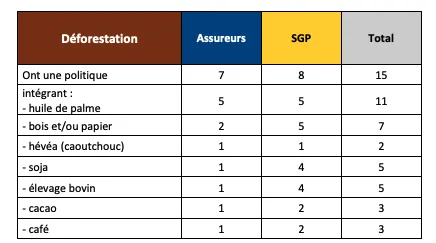
Deforestation
Assessment of policies using the ACT methodology
Among the 15 anti-deforestation policies identified and analysed, only 4 explicitly mention the value chains of portfolio companies (GCAM, BNPP AM, Mirova, Eurazeo, Predica)
Use of RSPO certifications: awareness of its limitations is important
Taxonomy
Most sample actors communicate at least on eligibility and alignment rates, expressed on the basis of turnover. Some communicate only on alignment
Average eligibility rate: 20% / average alignment rate: 5%
Explanation of year-on-year variations is rare (except AXA IM, Mirova and Abeille)
The proportion of estimated data versus data reported at the issuer level is rarely addressed, and rarely quantified.
For 3 actors, interactions between the taxonomy and the investment strategy were observed
Real estate SGPs: greatest dispersion in their ratios
Fossil Share
Poor definition → at least 20% of actors use a different definition and calculation method from the PAI 4 regulatory method:
Look-through approach
An approach limited to the most active actors (based on Urgewald databases)
An approach based on the primary activity sector (GICS code)
Explanation of year-on-year variations is rare
Insurers
The ACPR has established for insurers a standardised data collection mechanism for the required information, enabling aggregated statistical analysis, covering not only the ‘Article 29 LEC’ mechanism but also the ‘PAI’ reporting required by the European SFDR regulation. This year, 228 submissions from insurance undertakings were received.
Climate Strategies
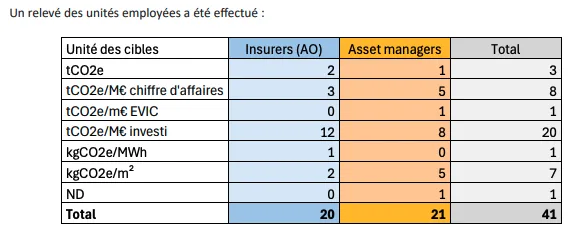
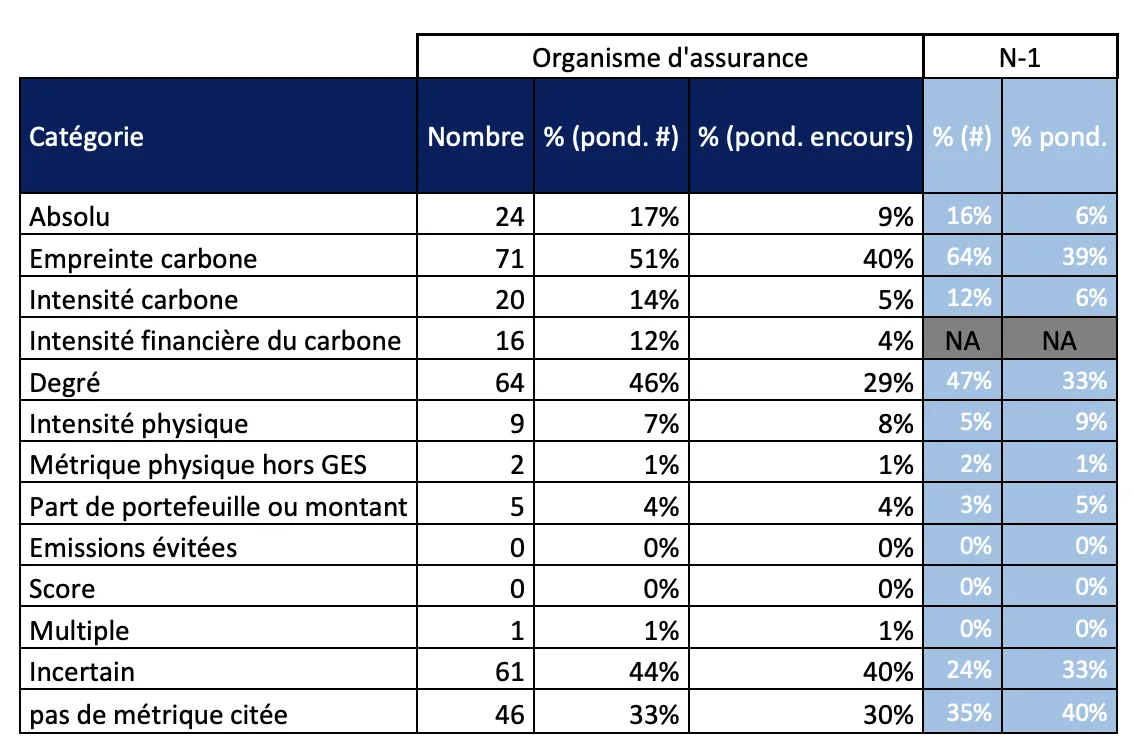
Types of units cited in the context of decarbonisation objectives:
Taxonomy:
Slight increase in the eligibility rate, due to the extension of the taxonomy to 4 additional environmental objectives and companies becoming more accustomed to the framework
Stability of rates between 2024 and 2025
Taxonomy alignment rate: ~5%
Taxonomy eligibility rate: ~20%
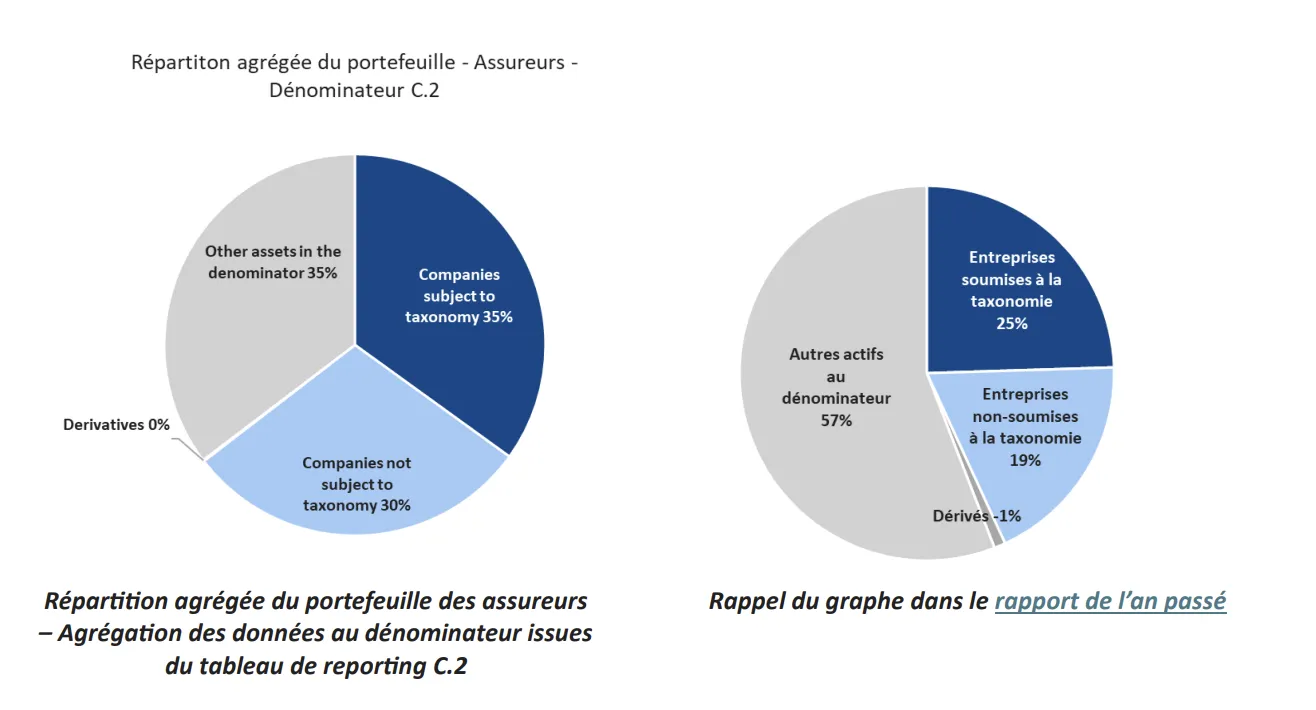
Analysis of the taxonomy status of the largest insurers’ portfolios was reproduced. 91 submissions were observed (vs. 80 last year):
Reduction in the quantity of ‘other assets’ in the denominator, due to improved data quality and progress in the look-through of insurers’ various positions
The CAPEX alignment rate remains higher than the revenue alignment rate (though this should not immediately lead to the conclusion that underlying companies are investing more in the transition)
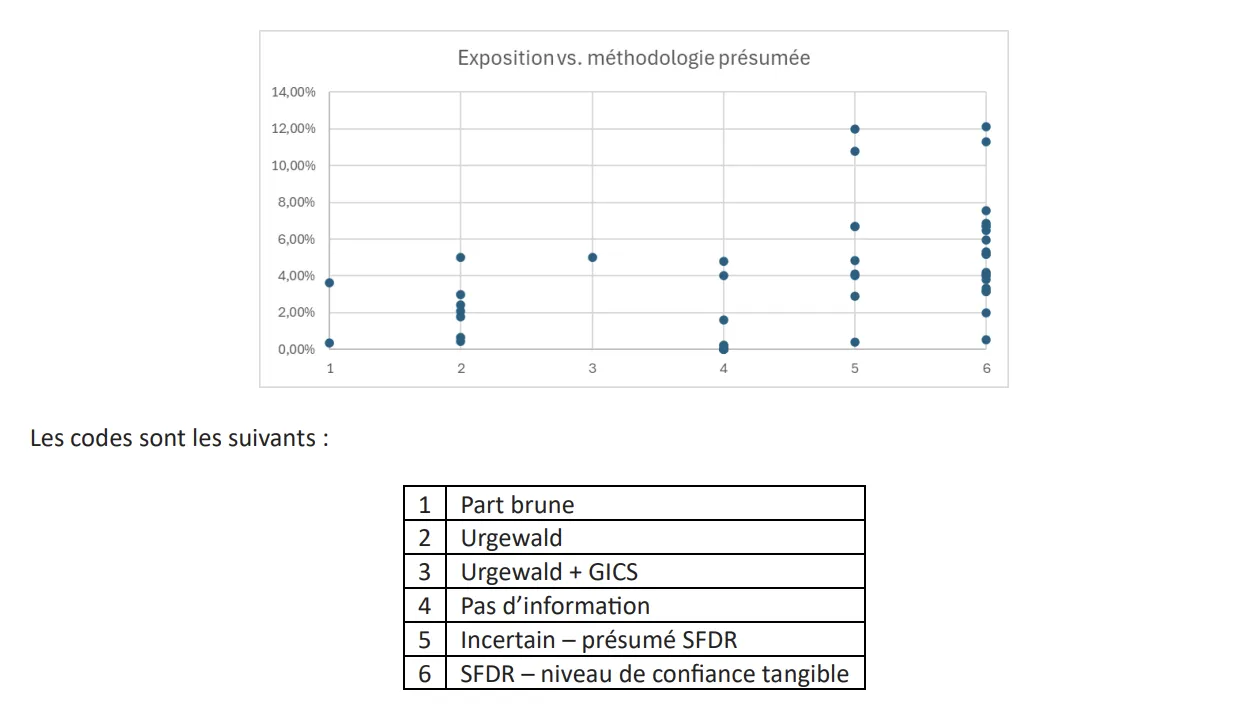
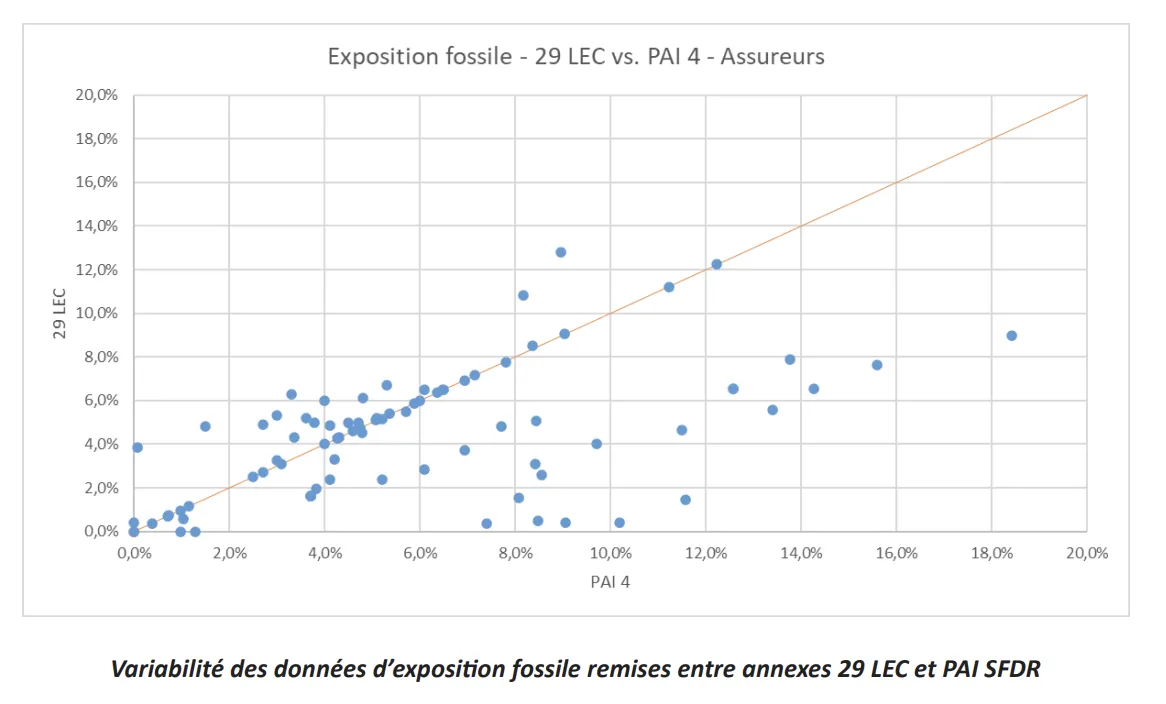
Fossil Share:
Most large actors report amounts between 0 and 5%
Data points in the lower part of the curve (indicating that the PAI 4 submission is higher than the Article 29 LEC submission) potentially indicate compliance with the regulatory definition for the former but not the latter → this does not allow comparability of the methodology used to be guaranteed.
Fossil Fuel Phase-out:
Coal exit dates: concentration around 2030 and 2040
Biodiversity:
Predominance of the MSA indicator
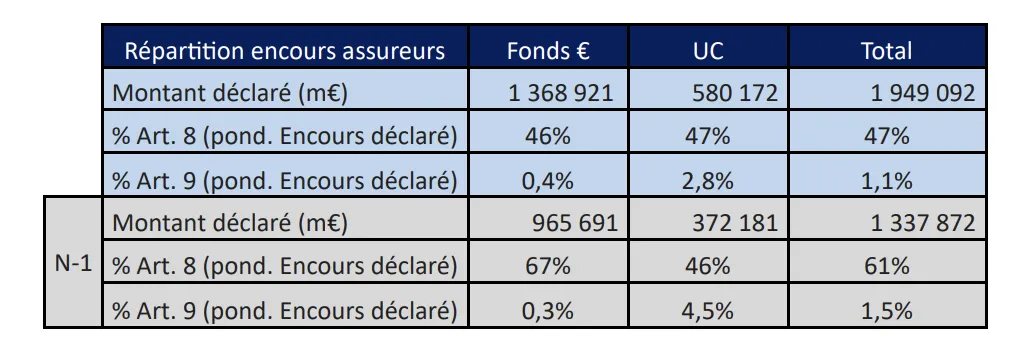
SFDR Articles 8 and 9
As last year, certain submissions from entities within the same group have been ‘duplicated’, which leads to overestimation of the actual overall total and biases the breakdown of assets under management.






.webp)